nc-turnout-trackerWhat This Tracker Tells You
Is turnout up or down? The top section compares turnout so far with the same day of early voting in 2018, 2020, 2022, or 2024.
Who is voting? The “Who has voted” section reports the share of votes cast by each party, race, and age group so far. It also tells you how those shares compare to the same point in previous years.
Are low-propensity voters showing up? A “low-propensity” voter is someone who voted in 0 or 1 of the last 3 federal elections, or voted in 2020 and 2024 but skipped 2022. See if these voters are turning out, and how their turnout differs by party, age, and race across the map.
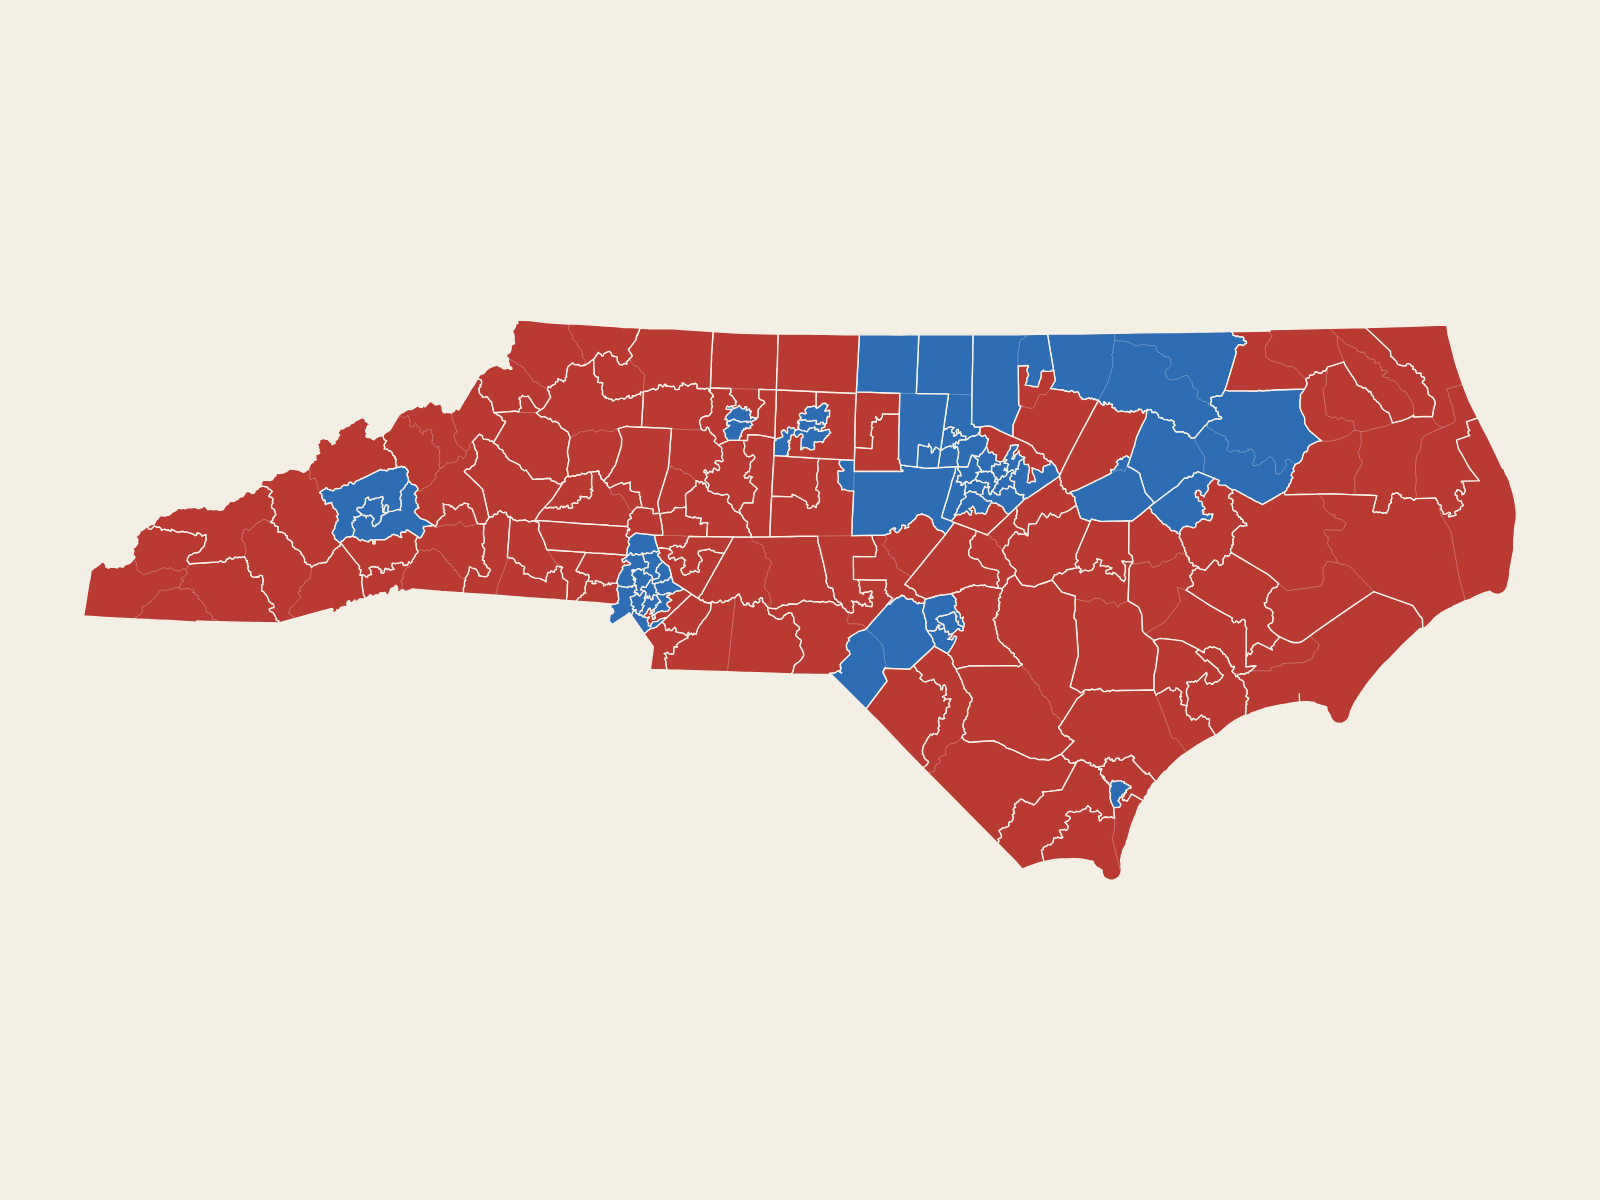
What’s happening in my county or district? Numbers for the state, counties, congressional and state legislative districts, and precincts, with trends and comparisons to previous years, illustrated in tables and maps.
What We Track
Mail ballots: We tell you how many have been cast in each geographic layer (e.g., statewide, your county, your house district, your precinct), how many have problems the voter can fix, and how many have already been fixed.
In-person early voting: We give you the numbers by day and by site for each geographic layer. “Early voting, day by day” allows you to layer voter turnout on corresponding days of early voting (for example, turnout on the first day of this election year compared to turnout on the first day of 2018, 2020, 2022, and/or 2024).
You can also isolate turnout statistics on individual days, or show turnout through this point. Both views can be compared to the equivalent day or period in prior years.
Election Day votes: Appear on November 3 and update at least every 20 minutes.
Final turnout: The final turnout statistics will appear in this tracker in late November or early December, once results have been finalized and confirmed.
Crosstabs: Voting patterns for various combinations of age, race, and party affiliations, with ready-to-share graphics you can download.
Propensities: How many high-propensity and low-propensity voters cast ballots in this election, and how that compares to previous cycles.
Cannibalization: How many election-day voters for Democrats, Republicans, and Unaffiliated voters cast ballots during early voting compared to the previous comparable cycle (i.e., 2026 vs. 2022, 2022 vs. 2018, etc.).
If you voted by mail, you can look up your ballot (or sign up for updates at the state’s BallotTrax portal) to see if it had any issues you need to resolve.
New Here? Five Things to Try
Find your place: Type your county, district, or precinct into the search box at the top. Every chart, map, table, and comparison will show the layer you have selected.
Pick a year to compare: Tap on one of the years at the top of the tracker. We recommend 2022 or 2018 to start. Green means this year’s turnout is ahead of turnout in the year you selected. Red means it’s running behind. It’s normal for a midterm year to run behind presidential years.
Tap a county on the map: When you tap or click on a county, a card will open displaying all the stats for that county. This works for districts, too. Use the buttons above the map to switch between turnout, party split, party split vs. registration, low-propensity turnout, low-propensity margin, and turnout by race.
Look at a single day: The “showing” bar switches the page from all votes so far to just the votes on a single day.
Share what you found: “Share this view” copies a link that reopens the same place, year, and day that you’ve selected. The share graphics turn a view into an image for social media.
Read It Right
Party means registration, not choice of candidate. “D+5” could mean that registered Democrats cast 30% of votes so far and registered Republicans cast 25%. It does not guarantee that all of those registered Republicans actually voted for Republicans up and down the ballot, or vice versa. A narrow margin could mean fewer Democrats or Republicans, but it could also mean a big increase in Unaffiliated voters.
Ahead early doesn’t mean ahead at the end. More and more people choose to vote early each cycle, and there have been changes to the rules for voting by mail. Early leads can change dramatically on Election Day.
Small places swing. In small counties and precincts, a few dozen voters can change a color or a percentage a lot.
Recent days can still change. Mail ballots with fixable problems get added on the day they arrive, not on the day that the voter fixes the problem. Election Day counts are unofficial until certification.
Other Questions You Might Have
How are you comparing turnout between cycles?
At the top of our tool, you’ll see a comparison between this year’s overall turnout and 2018, 2020, 2022, or 2024.
Between population growth, a long-term reshuffling of party affiliation, and a growing preference to remain unaffiliated, the relative size of each party’s membership keeps changing. That’s why we focus on turnout share rather than the raw change in votes cast by each party.
Who counts as a registered voter?
Our registration snapshots include active and inactive registered voters. That’s the largest possible count of registered voters, which ensures that we never overstate turnout. (Inactive voters are eligible to vote, but will likely be asked to verify their address at the polls.)
The voter file publishes weekly updates. Voters can register at early voting sites during early voting, so the true percentage of registered voters is a moving target. We will stop updating the registered voters denominator after Election Day.
Who counts as a new voter?
Someone who registered in North Carolina for the first time in 2026 and has no voting history here. You can see how many first-time registrants have voted, the turnout rate among this population, and what percentage of all voters so far they make up.
People who moved between counties, or who registered earlier but never voted, aren’t counted as new.
This section also includes information about how many people used same-day registration during early voting.
What’s important about “voter propensity”?
A low-propensity voter has voted in 0 or 1 of the last three federal elections, or voted in 2020 and 2024, but not 2022.
Voter propensity tells you if people who don’t reliably vote are coming out or not. When combined with registration and demographic data, this is one of the signs we use to guess how the election will ultimately go.
Shouldn’t we just wait for the final results after the election is over?
But our tracker is so pretty! If you can wait, be our guest. If you’ve just got to know what’s happening every day—or several times an hour on election night—we’ve got your back.
What kind of data about people can we see?
For each layer of data, you can toggle between Party, Age, Race, and Voter Propensity. We did not initially include race because it is a self-reported category that about 10% of voters leave blank. (It’s closer to 1 in 6 among those who have registered since 2020!)
What can I learn about my early voting site or my precinct?
Everything that you can learn about any other geographic layer! We’ve got demographic data, single day or cumulative turnout data, and comparisons to past elections.
Why don’t I see any candidate results?
This is a turnout tracker, not an election results tracker. For that, we recommend er.ncsbe.gov. But stay tuned—we may have something fun up our sleeves…
Why is my precinct missing?
To protect voter privacy, precincts with fewer than 10 votes are combined into a single line in their county’s table. If only one precinct in a county would be hidden, we combine it with the next-smallest precinct.
Why did some numbers change since yesterday?
As county boards of election process ballots, you may see changes to the data reported here. For example, a ballot that gets cured will be added to the data for the day on which it was received, not necessarily the day on which it was cured.
When are these numbers official?
The state deadline for certifying elections is November 24, although it could run as late as December if there are any complications to resolve. Our final turnout numbers come from the State Board’s official voter history, usually a few weeks after the election. When they’re in, the tracker will say “Final turnout.”
Where can I count rejected ballots?
We’ve included a “How we count” section at the bottom of this tool. In it, you’ll see a table with every returned ballot the board hasn’t accepted and the state-designated code describing its status.
Why are your numbers different than another tracker I looked at?
County boards typically tally everyone who presented a ballot that day. We report only accepted ballots. We don’t include cancelled, spoiled, or replaced ballots in the day’s voter totals. We also include a couple of state codes in the “need a fix” or “cure” section of the tracker that some other trackers may not currently include. The codes we include in the “need a fix” category are based on conversations with staff at several different county boards.